

- Topic
34k Popularity
48k Popularity
11k Popularity
2k Popularity
2k Popularity
- Pin
- 🎉 Attention Alpha fans! Alpha’s latest TAG airdrop goes live today at 10 AM—first come, first served!
💰 Don’t forget to share your airdrop or points screenshot on Gate Square with the hashtag #ShowMyAlphaPoints# for a chance to win a share of the $200 token mystery box!
🥇 Top points winner: $100
✨ 5 outstanding posts: $20 each
📸 Pro tips:
Add a caption like “I earned ____ with Alpha. So worth it”
Share your points-earning tips or redemption experience for a better chance to win!
📅 Activity deadline: August 10, 18:00 UTC
Let’s go! See you tonight: https://www.gate.com/announcements/article - Hey fam—did you join yesterday’s [Show Your Alpha Points] event? Still not sure how to post your screenshot? No worries, here’s a super easy guide to help you win your share of the $200 mystery box prize!
📸 posting guide:
1️⃣ Open app and tap your [Avatar] on the homepage
2️⃣ Go to [Alpha Points] in the sidebar
3️⃣ You’ll see your latest points and airdrop status on this page!
👇 Step-by-step images attached—save it for later so you can post anytime!
🎁 Post your screenshot now with #ShowMyAlphaPoints# for a chance to win a share of $200 in prizes!
⚡ Airdrop reminder: Gate Alpha ES airdrop is - Gate Futures Trading Incentive Program is Live! Zero Barries to Share 50,000 ERA
Start trading and earn rewards — the more you trade, the more you earn!
New users enjoy a 20% bonus!
Join now:https://www.gate.com/campaigns/1692?pid=X&ch=NGhnNGTf
Event details: https://www.gate.com/announcements/article/46429 - Hey Square fam! How many Alpha points have you racked up lately?
Did you get your airdrop? We’ve also got extra perks for you on Gate Square!
🎁 Show off your Alpha points gains, and you’ll get a shot at a $200U Mystery Box reward!
🥇 1 user with the highest points screenshot → $100U Mystery Box
✨ Top 5 sharers with quality posts → $20U Mystery Box each
📍【How to Join】
1️⃣ Make a post with the hashtag #ShowMyAlphaPoints#
2️⃣ Share a screenshot of your Alpha points, plus a one-liner: “I earned ____ with Gate Alpha. So worth it!”
👉 Bonus: Share your tips for earning points, redemption experienc - 🎉 The #CandyDrop Futures Challenge is live — join now to share a 6 BTC prize pool!
📢 Post your futures trading experience on Gate Square with the event hashtag — $25 × 20 rewards are waiting!
🎁 $500 in futures trial vouchers up for grabs — 20 standout posts will win!
📅 Event Period: August 1, 2025, 15:00 – August 15, 2025, 19:00 (UTC+8)
👉 Event Link: https://www.gate.com/candy-drop/detail/BTC-98
Dare to trade. Dare to win.
XRP’s path to $6 is now clear after turning green
After reclaiming the $3 resistance level, XRP has reignited its bullish momentum, with technical indicators pointing to a potential record high above $6.
In this line, cryptocurrency trading analyst Master Ananda noted that this move could play out within weeks, as XRP remains in the early stages of its bull market, according to a TradingView post on August 4.
Master Ananda**TradingView As per the outlook, XRP recently found strong support just above the 0.618 Fibonacci level at $2.71, sparking an immediate rebound. A green daily candle reversed the drop and broke resistance, followed by another green candle that confirmed the bullish reversal.
Ananda emphasized that this move is part of a broader 2025 bull market cycle, where bullish momentum is expected to persist
AnandaHe added that while some traders may wait for further confirmation, the technical rebound and swift recovery already signal a resumption, and possible acceleration, of the bullish trend.
XRP’s path to $4
Another bullish outlook was shared by pseudonymous crypto analyst Lord of Alts, who noted that XRP is on the verge of a major breakout. Technical charts show one of the largest bullish pennants in months, with the token holding firm above key support levels.
Lord of Alts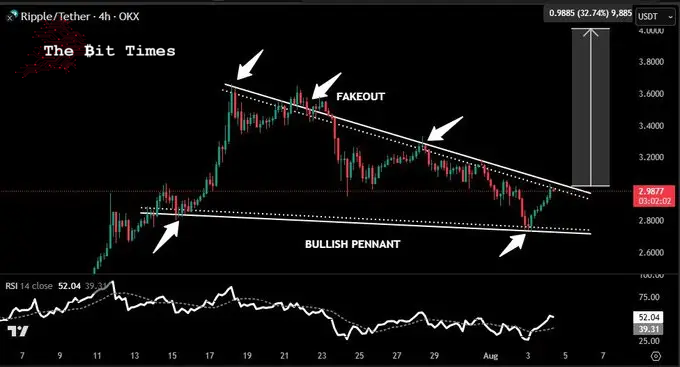 XRP price analysis chart. Source: TradingView**XRP price analysis chart. Source: TradingViewThe pattern suggests consolidation ahead of a potential sharp move higher. If confirmed, the breakout could see XRP target the $4 mark.
XRP price analysis
At press time, XRP was trading at $3.04, up 1.2% over the past 24 hours, though down 3.6% on the weekly chart.
Meanwhile, the 14-day Relative Strength Index (RSI) stands at 54.70, indicating neutral territory with a slight bullish tilt, suggesting there is room for further upside before the asset becomes overbought.
Featured image via Shutterstock
Featured image via ShutterstockFeatured image via Shutterstock